


How does BON Analytics feature work?
Understand what each section in Analytics represents, how the numbers are calculated, and how to export the data you need
NOTE: This Analytics feature is available on the Basic plan and higher. Check out our Pricing plan for more details!
Introduction
Understanding how BON is impacting your store and how customers are engaging with your loyalty program. Use these insights to spot what’s working, fix what isn’t, and export the underlying data whenever you need it outside the app.
Overview
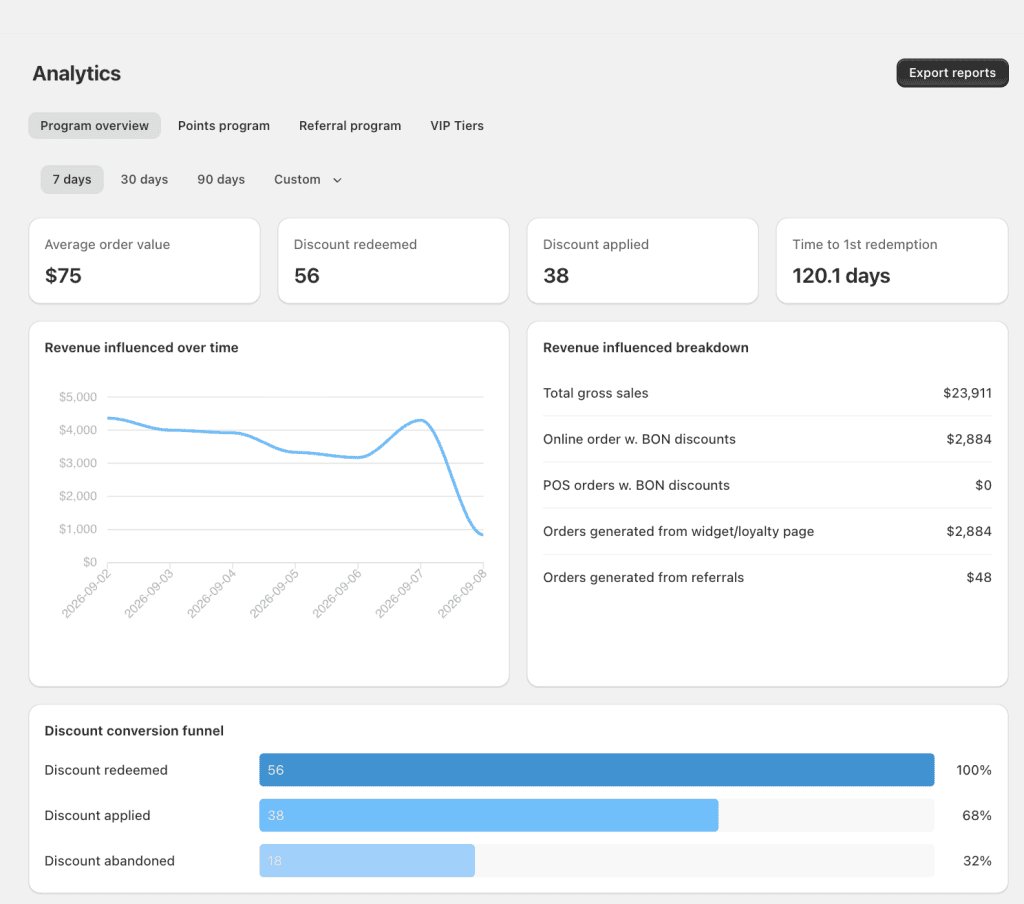
Analytics is organized into 5 sections. The first four give you an at-a-glance view of your program’s performance; the fifth, Export Reports, is a newer addition that lets you pull the raw data behind these numbers into a file of your own.
- Program overview: How the loyalty program is contributing to your store’s revenue – revenue influenced, average order value, and how long it takes for a customer to redeem their first reward (time-to-first-value).
- Points program: How points are earned and redeemed across your store.
- Referral program: How referrals are driving new customers and revenue.
- VIP Tiers: How customers are distributed and moving across your tiers.
- Export Reports (new): Export the data files you need with our 5 pre-built reports, on demand or with recurring schedules.
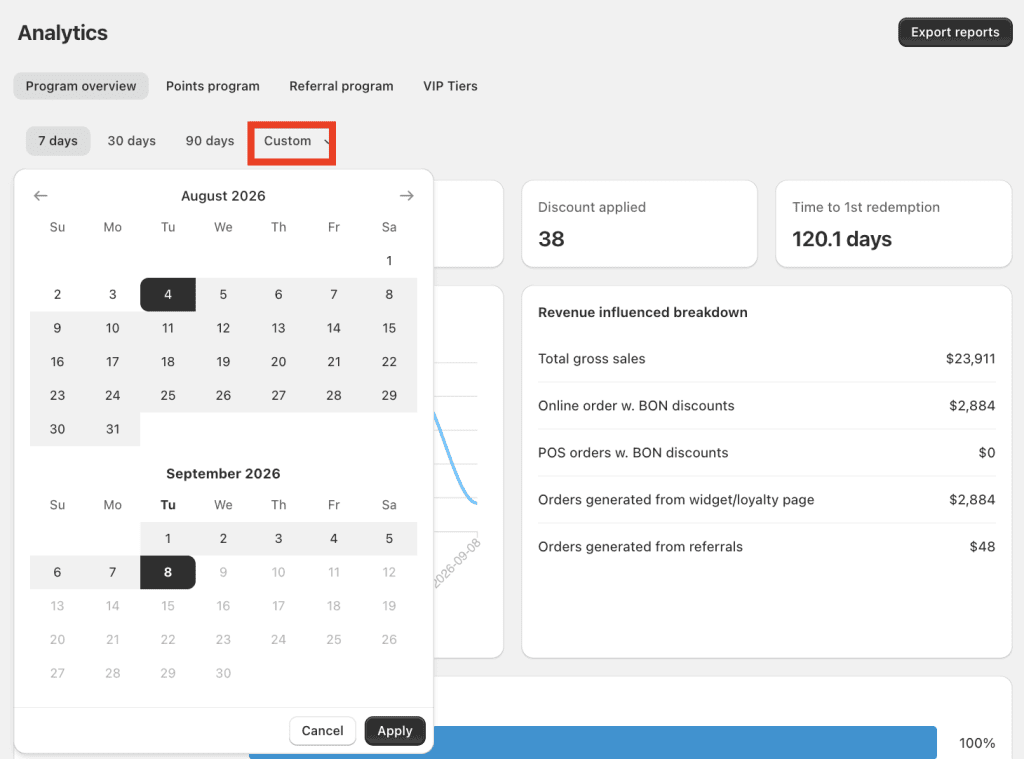
1. Program overview
- Revenue influenced (over time): Total revenue from orders where a customer used a BON reward, orders from successful referrals, and orders completed via the BON Widget/Loyalty page.
- Average order value (AOV): The average value of orders influenced by BON, calculated after discounts are applied – so an order isn’t counted at its pre-discount subtotal.
- Discount redeemed: Reward codes customers have generated, whether or not they’ve used them in an order yet.
- Discount applied: Redeemed codes that were actually used at checkout on a completed order.
- Discount abandoned: Codes that were redeemed but never used.
- Discount conversion funnel: Visualizes the drop-off across the three stages above, so you can see where customers stop following through.
- Time to 1st redemption: Average number of days between a customer joining your program and redeeming their first reward.
- Revenue influenced breakdown: Splits total influenced revenue into: online orders with a BON discount, POS orders with a BON discount, orders from the Widget/Loyalty page, and orders from referrals.
2. Points program

- Total points earned / Total points redeemed: Totals for your selected date range. Points from refunded orders aren’t counted.
- Redemption rate: Calculated by taking the total points redeemed divided by total points earned, shown as a percentage. The benchmark for a healthy loyalty program is 20%-30%.
- Action earn points over time / Action redeem points over time: Charts showing how point-earning and point-redeeming activities trend over your selected period.
- Top ways customers earn: The 5 most common ways customers earn points – this can include actions like signing up, completing an order, following you on social media, leaving a review, etc.
- Top ways customers redeem: The 5 most-redeemed reward types.
HELPFUL TIPS: If your redemption rate is low, it may mean your rewards need too many points to unlock, or that the rewards on offer aren’t compelling enough – customers are earning but not finding a reason to spend.
3. Referral program
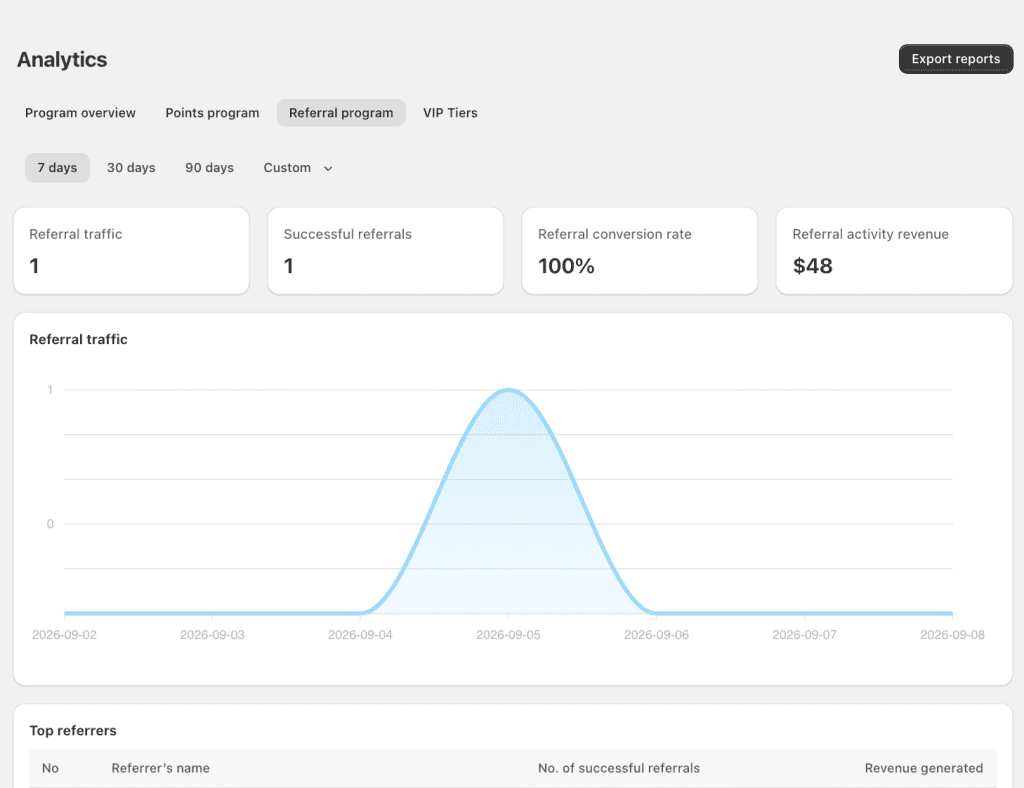
- Referral traffic: Visits to your store that originated from a referral link.
- Successful referral: Referrals that resulted in a completed order.
- Referral conversion rate: Share of referral traffic that converts into a completed order.
- Referral activity revenue: Total revenue from orders placed via referral links. This is calculated net of refunds – if a referred order is partially refunded, the refunded amount is subtracted.
- Top referrers: A ranked list of your customers by number of successful referrals and revenue generated.
4. VIP Tiers
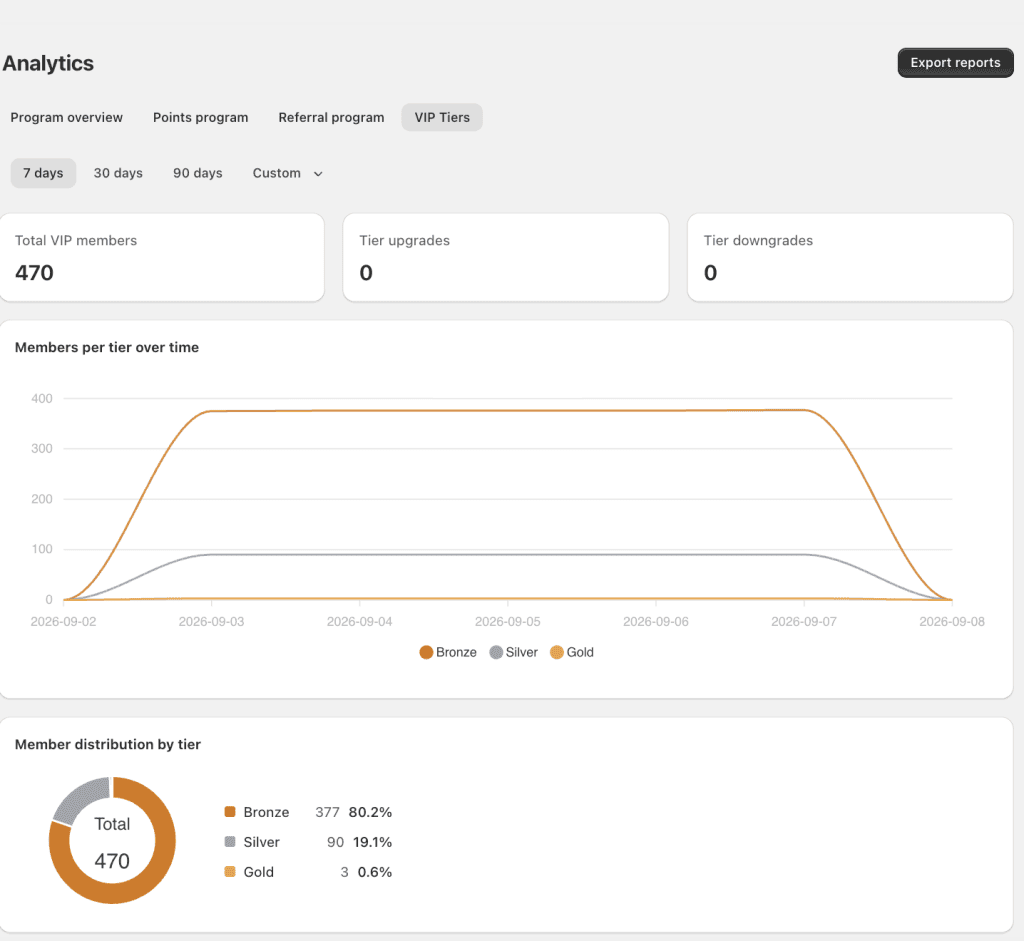
NOTE: VIP Tier program tab will only visible if the program is activated.
- Total VIP members, Tier upgrades, Tier downgrades: Counts for your selected date range. These include both automatic tier changes and any manual tier assignments you make yourself.
- Member distribution by tier: Breakdown of how many members sit in each tier.
- Avg. spending per customer by tier (Only tracked when you use Money spent as Entry method): Average amount spent by customers in each tier. If your Entry method is set to “Points earned” instead, spending isn’t logged for tier purposes, so this won’t show data.
HELPFUL TIPS: VIP membership numbers refresh on a daily cycle, so a manual tier change may take up to a day to be reflected in these totals and charts.
5. Export Reports (new)
Export Reports lets you download the data behind the sections above as a CSV file – either as a one-time export or on a recurring schedule.
How to create a report
- Go to Analytics → Export reports.
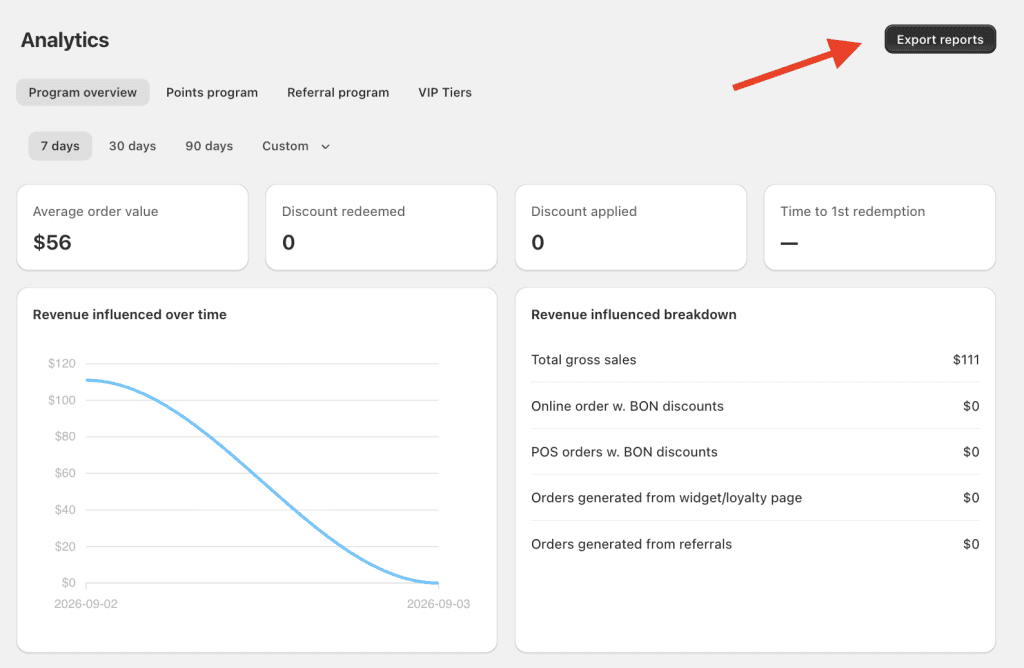
2. Select a report type – one of: Customer Data, Points program, VIP tier export, Referral program or Discounts & reward.
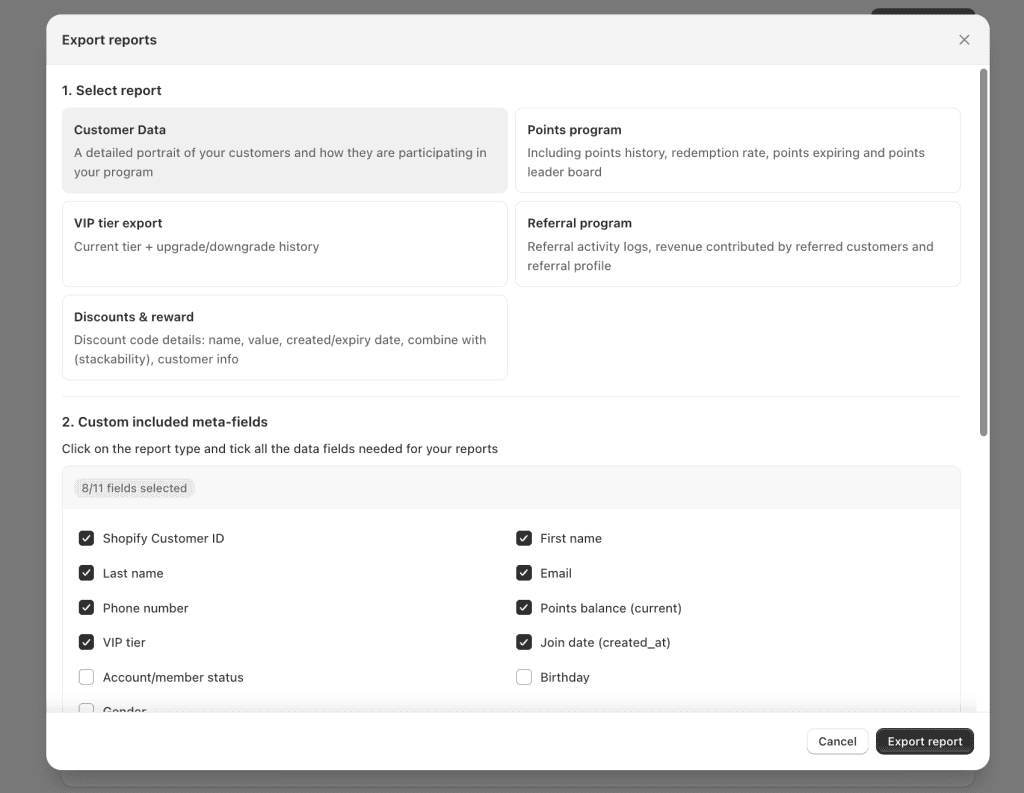
3. Tick the data fields you want. The field list is specific to the report type you selected, with a live counter (e.g. “3/12 fields selected”). Some fields cannot be combined into one report file, considering exporting into separate reports.
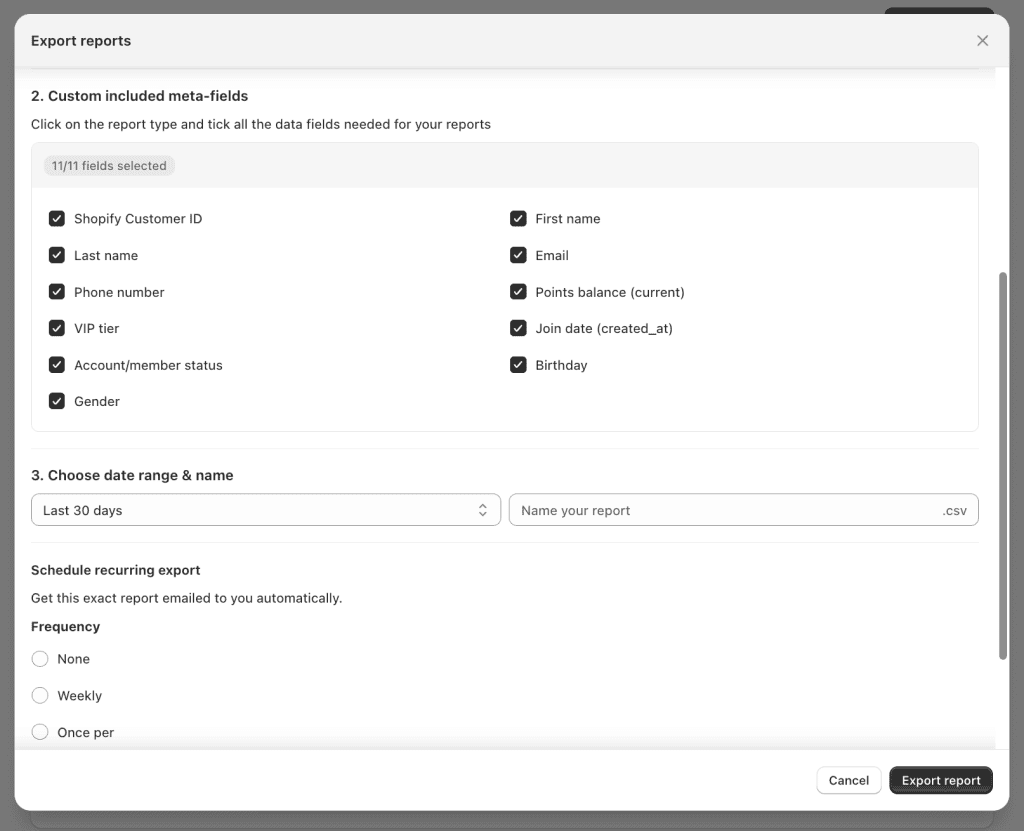
4. Choose a date range and name your report. It’s sent as a .csv file; the filename includes an export_report_analytic_ prefix followed by the name you entered.
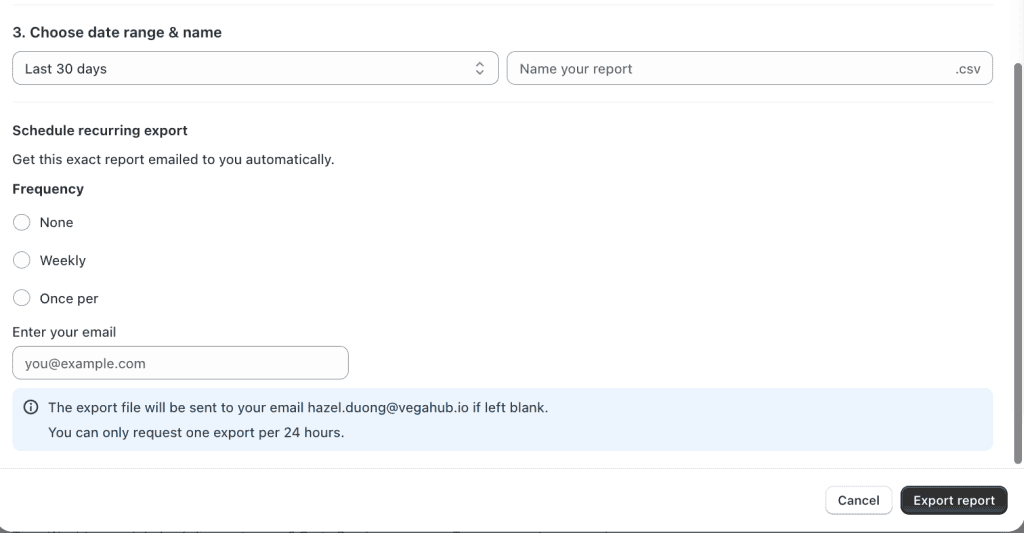
5. Click Export – the file is emailed to you once it’s ready.
- Customer Data – a detailed portrait of your customers and how they’re participating in your program: Shopify Customer ID, First/Last name, Email, Phone number (only the number a customer entered via BON’s Complete profile action, not synced from Shopify), Points balance, VIP tier (requires VIP Tiers enabled on your plan), Join date, Account status, Birthday, Gender, Total spending (calculated from orders recorded in BON – may differ slightly from Shopify’s own totals due to sync timing), Total orders, Rewards currently owned (unredeemed).
- Points program – points history, redemption rate, points expiring, and a leaderboard: Total points earned/redeemed, Points earned — detailed (date + reason), Points redeemed – detailed (reward + date), Available balance, Top earners/redeemers, Monthly aggregate (Month/Year), and Points expiring soon — which, despite the name, lists points that have already expired along with the date they expired, so you can review lost reward value and plan a win-back reminder.
- VIP tier export – current standing plus upgrade/downgrade history: Current tier per customer, Tier upgrade/downgrade history (manual and automatic changes both included), Separate sheet per tier (formatting option), Filter to a specific tier, Avg. spending by tier (same Entry method caveat as the dashboard version above).
- Referral program – activity logs, revenue, and referral profiles: Referral link/code per customer, Referral activity log, Orders acquired through referral, Reward status (shown as “Redeemed”/”Pending” here – the same states shown as “Successful”/”Not yet” elsewhere in the app), Successful referral count. Referrer and referred-friend identities are shown as email address rather than name, since customer accounts don’t always have a name on files.
- Discounts & reward – Discount details: name, code, value, created date, expiry date, combine with (stackability), customer (Shopify ID, email, name)
Scheduling a recurring report
Turn on Schedule recurring export and choose a frequency:
- Daily
- Weekly – pick a day of the week (e.g. every Monday).
- Monthly – pick a day of the month (Day 1–28), or Last day of the month, since days 29–31 aren’t offered individually since they don’t exist every month.
The report will keep sending on that schedule, with the same report type, fields, and date range, until you turn scheduling off.
Good to know
- Each export covers one report type at a time; report types can’t currently be combined into a single file. If you need data from more than one, run separate exports.
- Very large exports are processed in the background – you’ll still get an email once it’s ready, it may just take a little longer than a small one.
Was this page helpful?
On this page
Toggle